A suite of tools for conveyor belt diagnostics and monitoring
DiagBelt+ is a diagnostic system designed to assess the technical condition of steel-cord (ST) conveyor belts in industrial environments. It enables analysis of the belt core and identification of changes indicating degradation of the steel cords, supporting maintenance decisions and service planning before failures occur.
The system uses a magnetic method - i.e., it measures signal variations related to the condition of the cords within the belt core. The solution employs a sensor array (90 inductive sensors spaced at 25 mm), providing repeatable data across the belt width.
DiagBelt+ also enables assessment of splice geometry and splice workmanship quality, helping to identify potentially problematic areas and compare results between successive inspections (trend analysis, wear progression, and repair effectiveness).
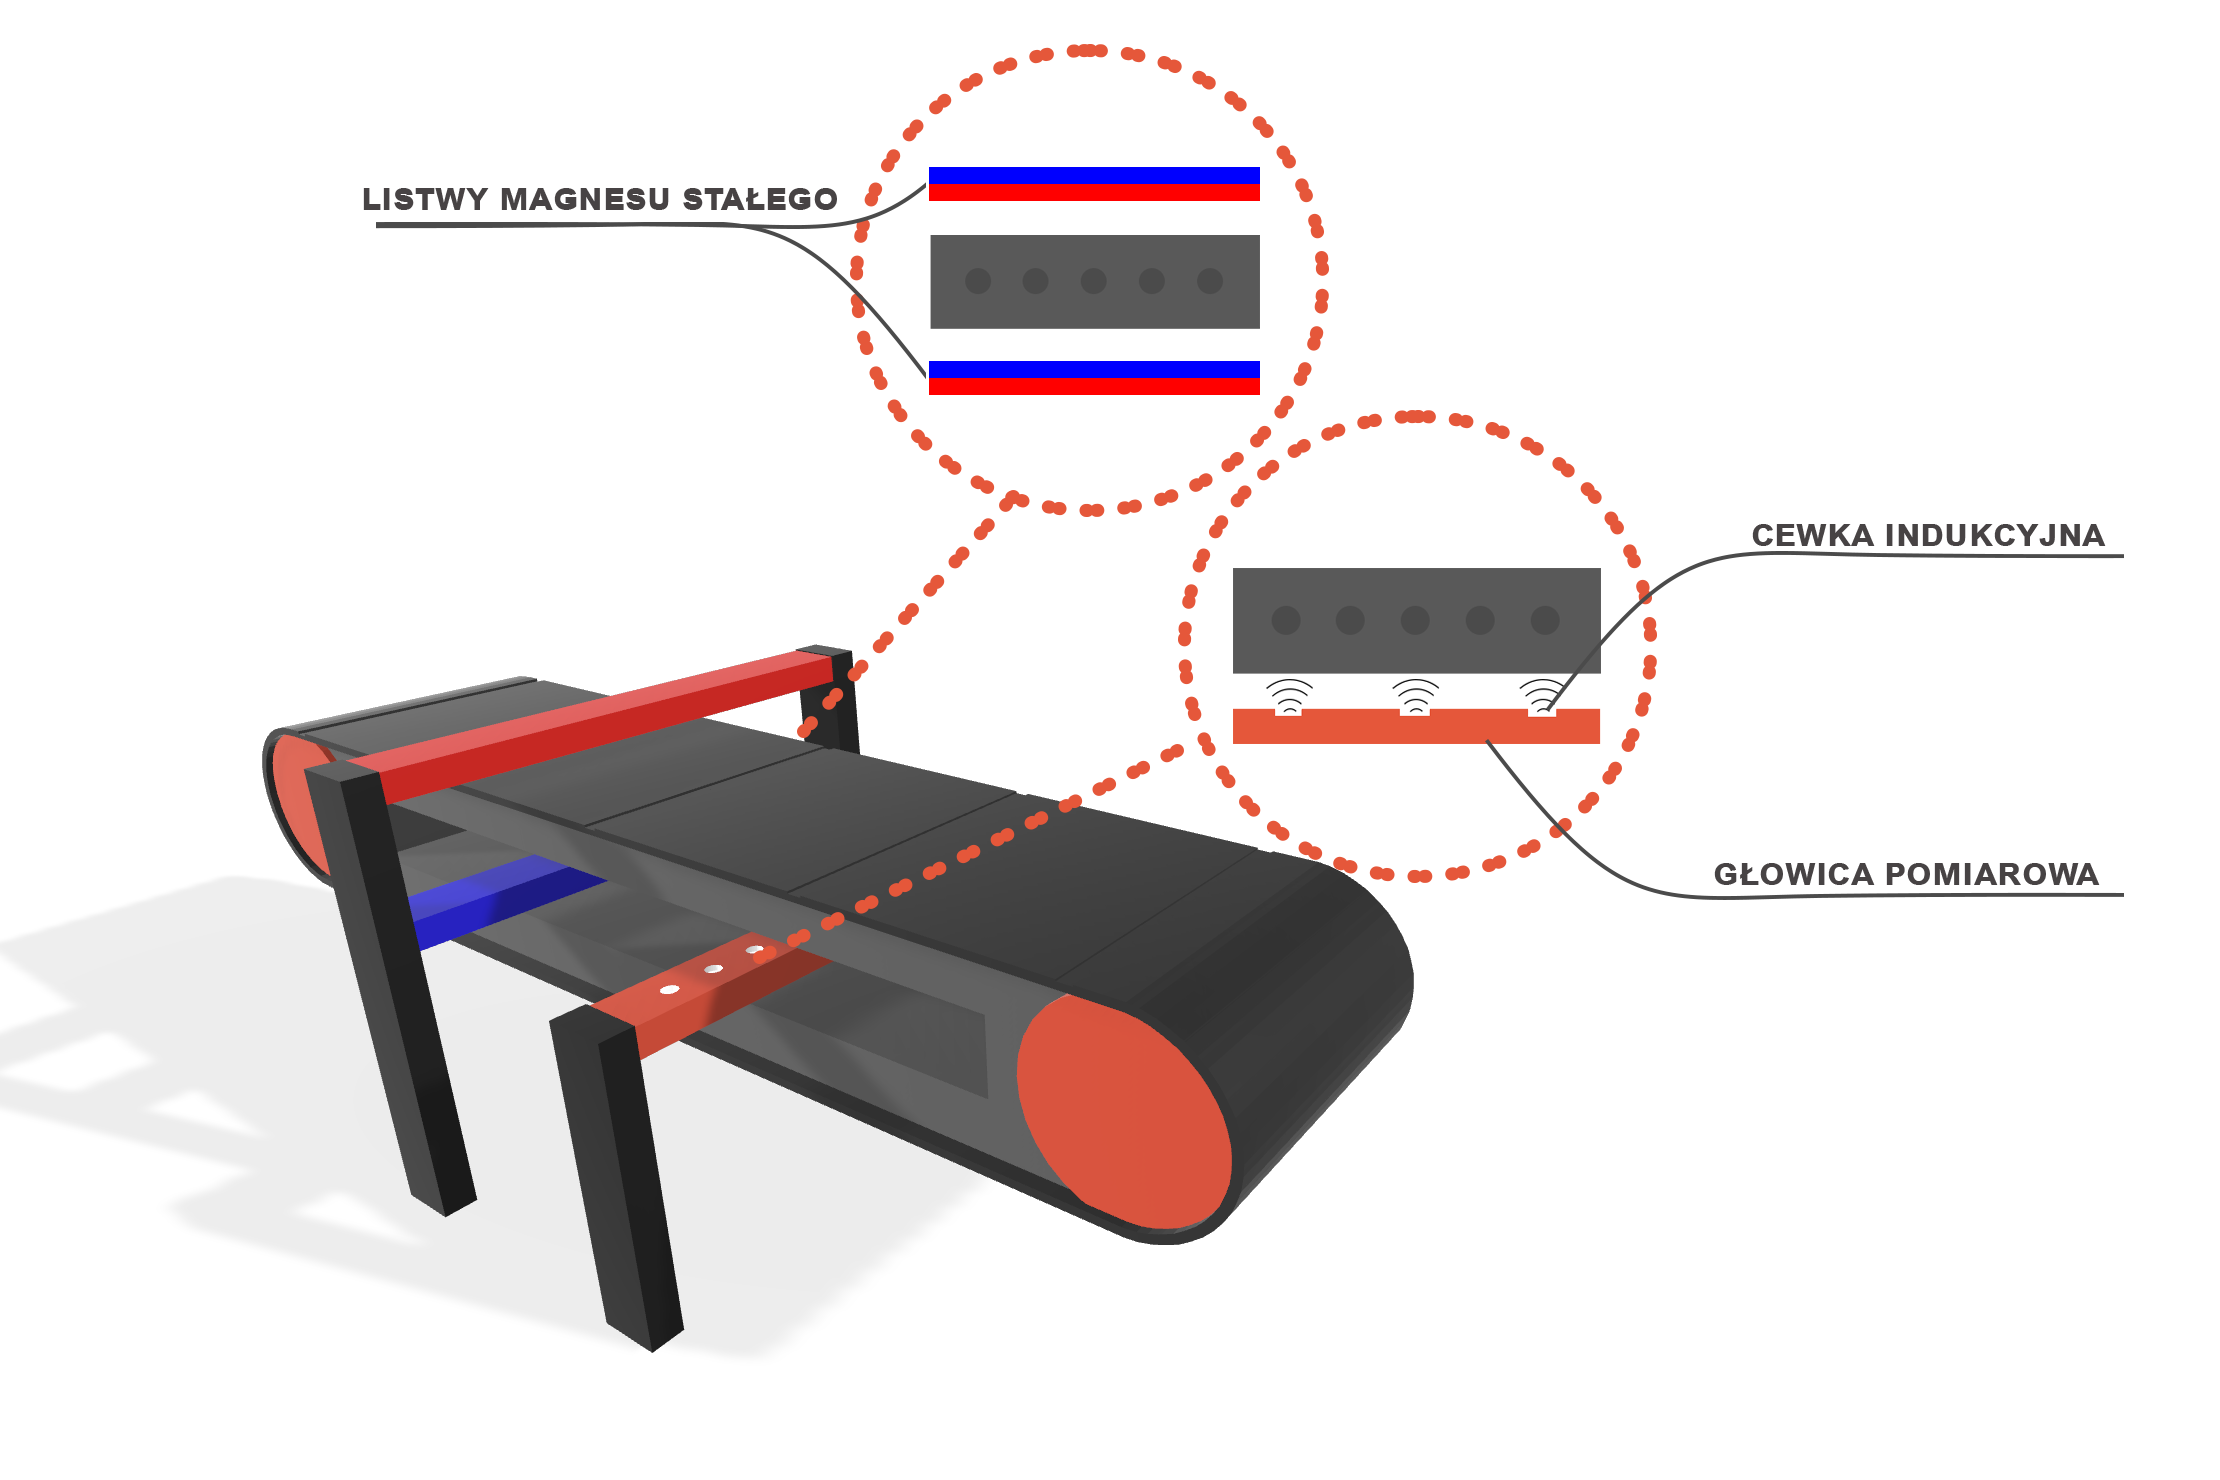
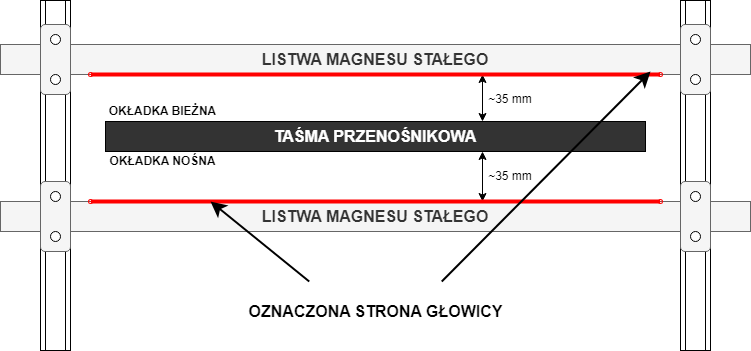
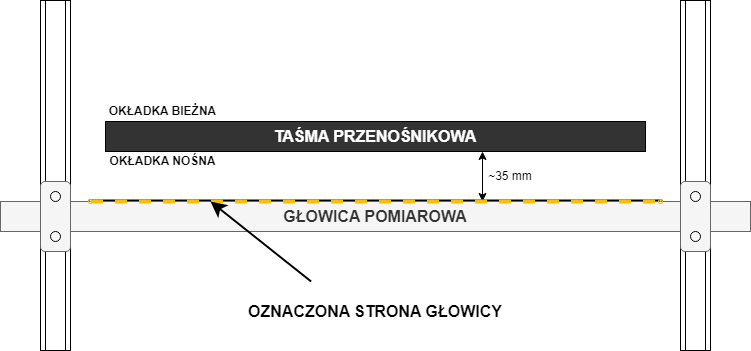
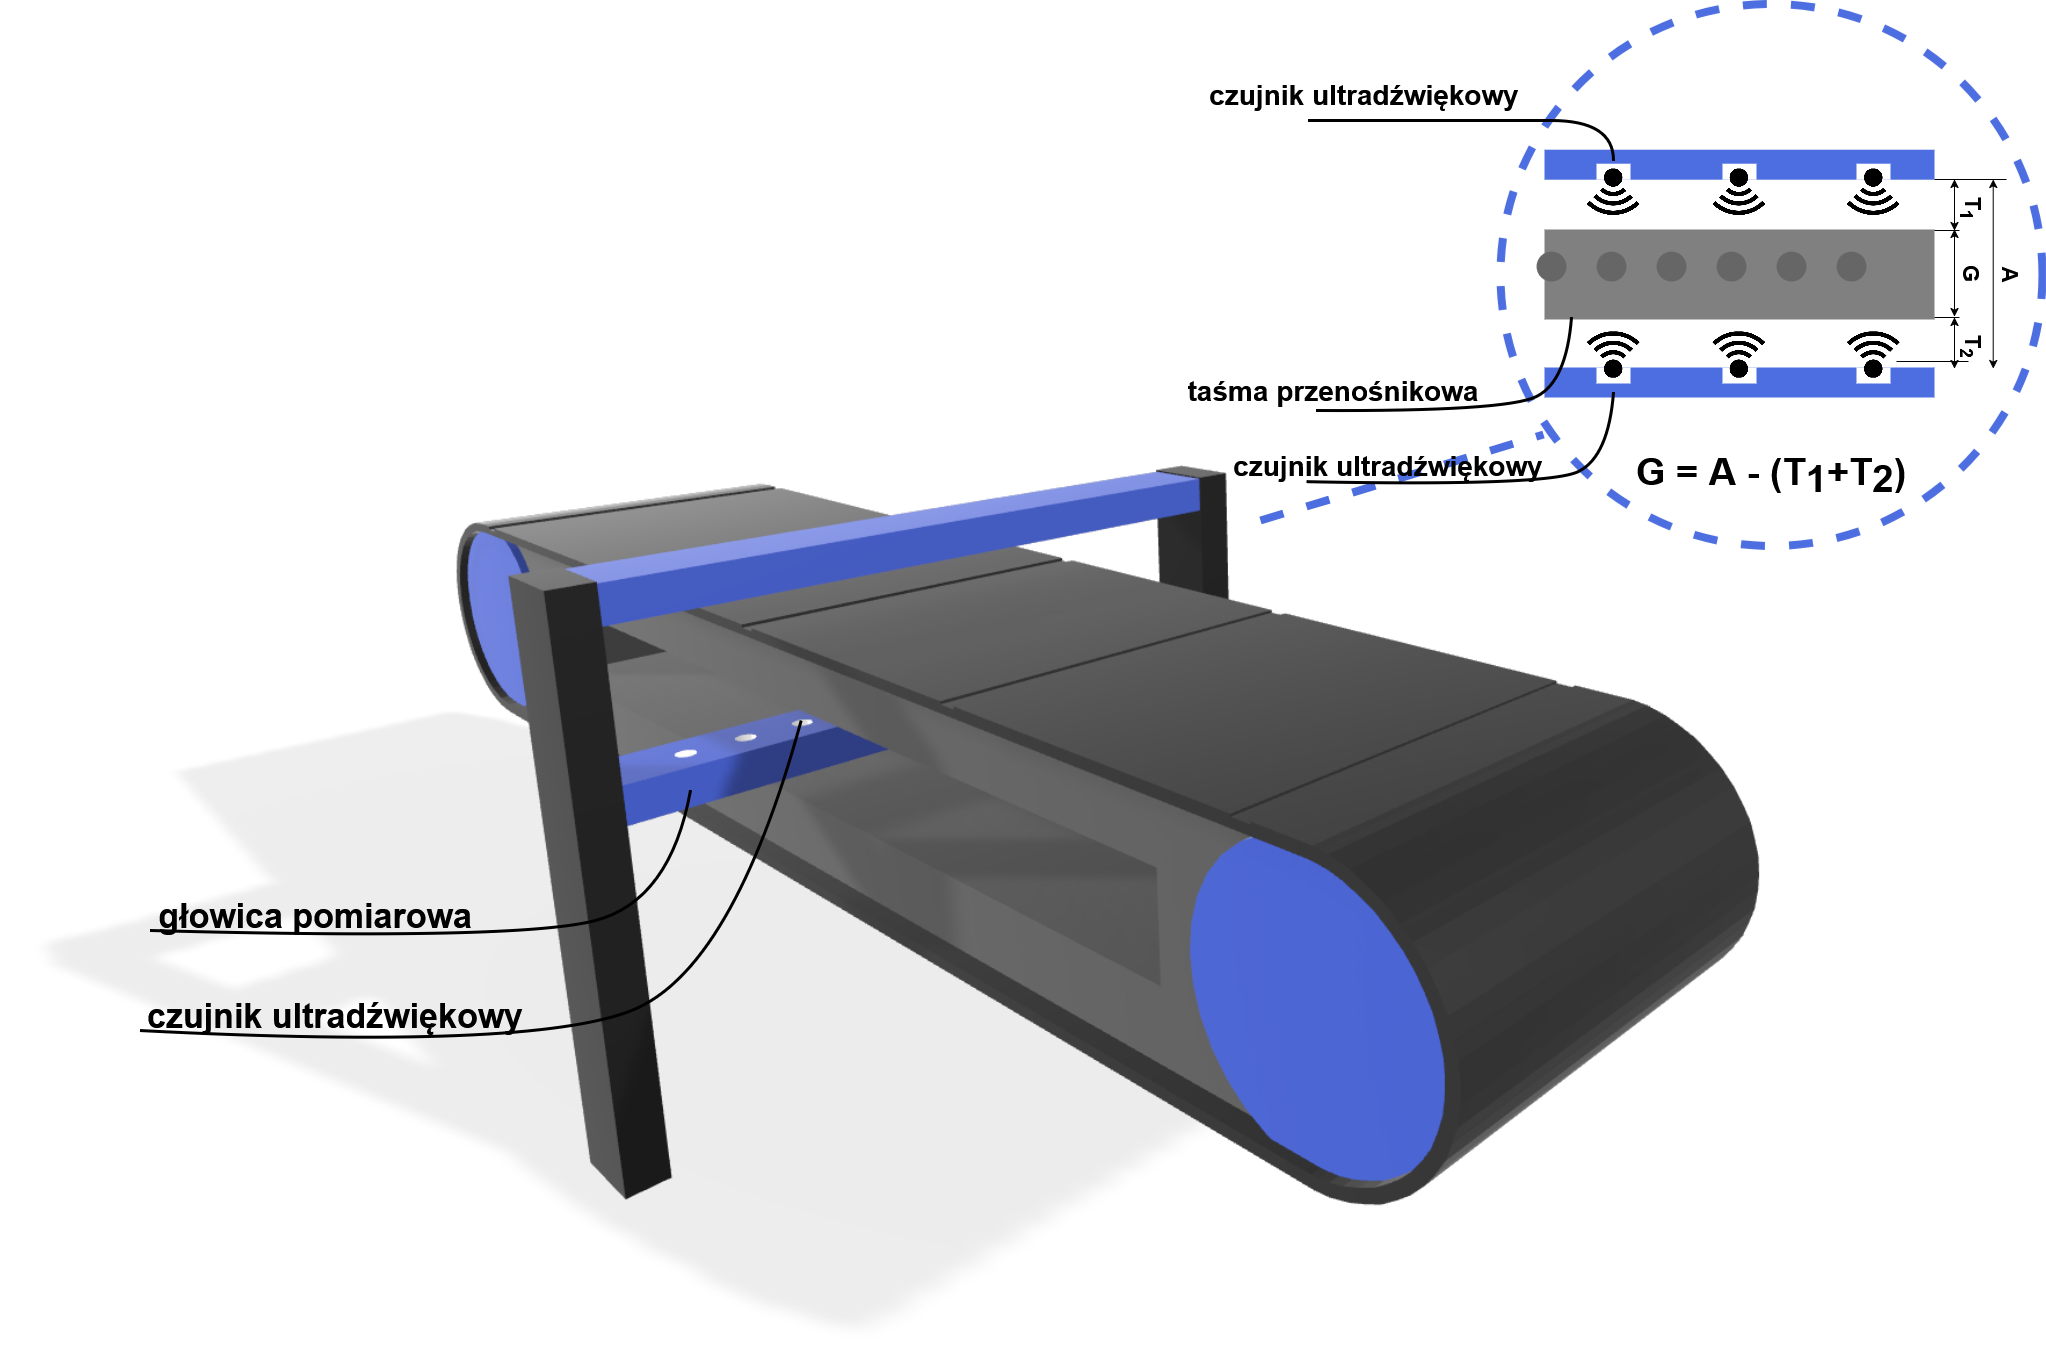
In practice, the DiagBelt+ system requires installation of permanent-magnet bars (conditioning heads) above and below the belt. These magnetic bars magnetize the steel cords in the belt core. Where discontinuities occur—such as cord breaks or changes in magnetic properties—a leakage flux is generated, and 90 inductive sensors installed in the measuring head record the resulting magnetic field variations at the locations of cord discontinuities. The system operates at a sampling frequency of 400 Hz, which corresponds to a measurement resolution of 2.5 mm at a belt speed of 1 m/s. The spacing between sensors is 25 mm.
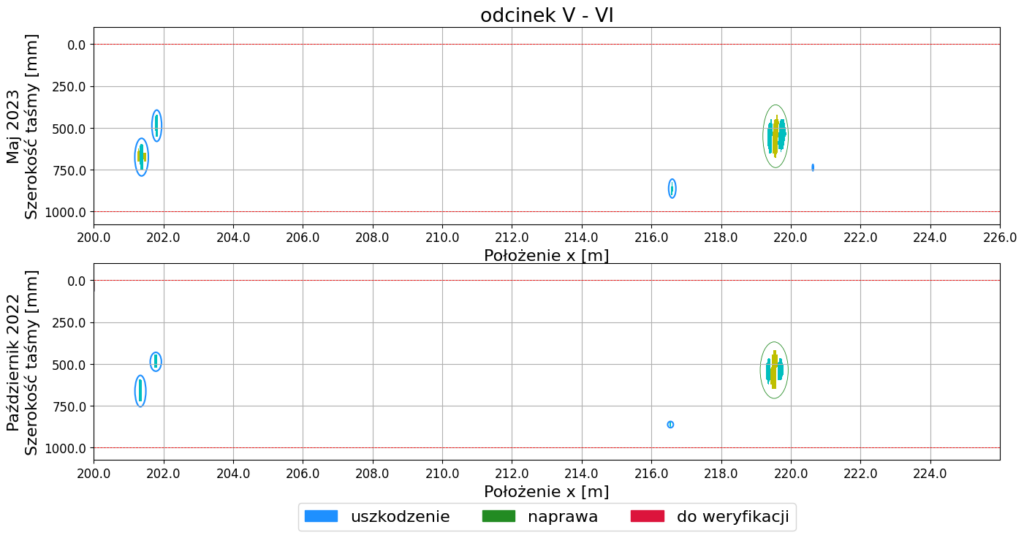
A map-based visualization shows the distribution of belt core damage along the belt length and across its full width. This makes it easy to see whether the issue is localized (single hotspots) or dispersed (many minor changes). The map helps quickly identify areas that require verification and compare different belt sections with one another. It is also a clear, practical element for reports and maintenance discussions.
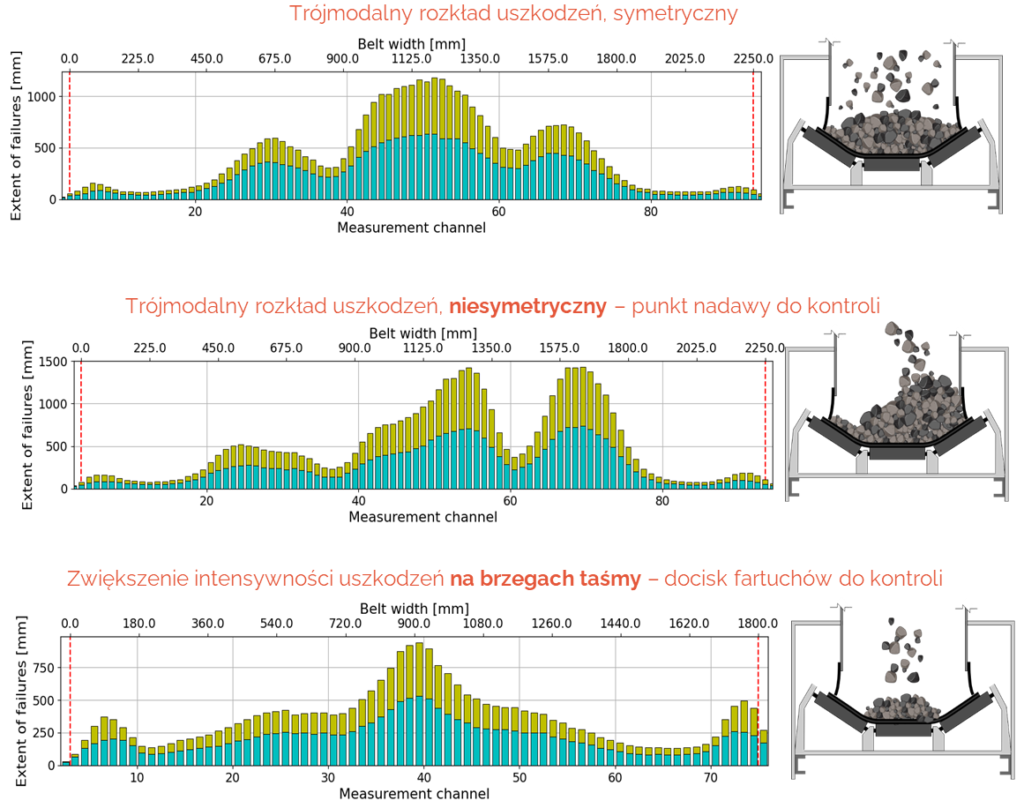
A transverse cross-section helps assess which zones across the belt width are most heavily loaded or most prone to degradation. This is particularly useful when damage concentrates within a specific band of cords (e.g., near an edge or along the belt centerline), which may indicate issues related to belt tracking, idlers/rollers, loading conditions, or operating environment. The cross-section also helps determine whether changes are point-like or more extensive across the width. In practice, it provides a faster understanding of where the problem occurs within the core.
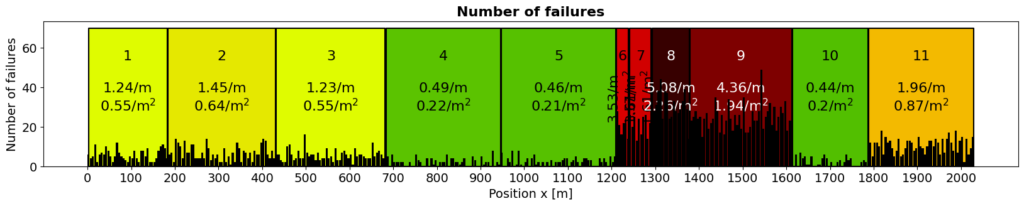
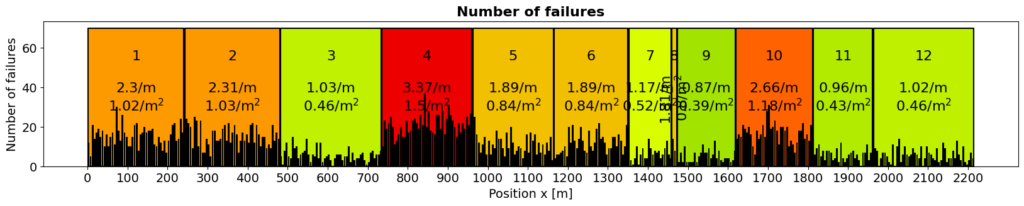
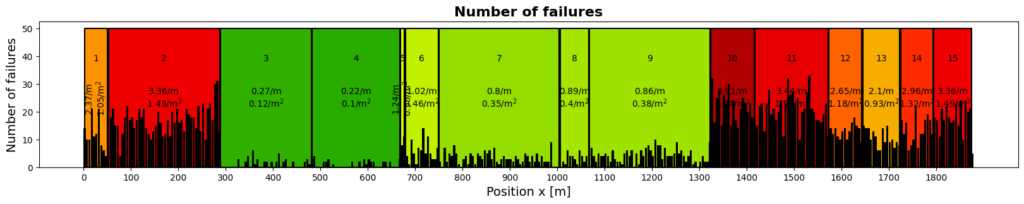
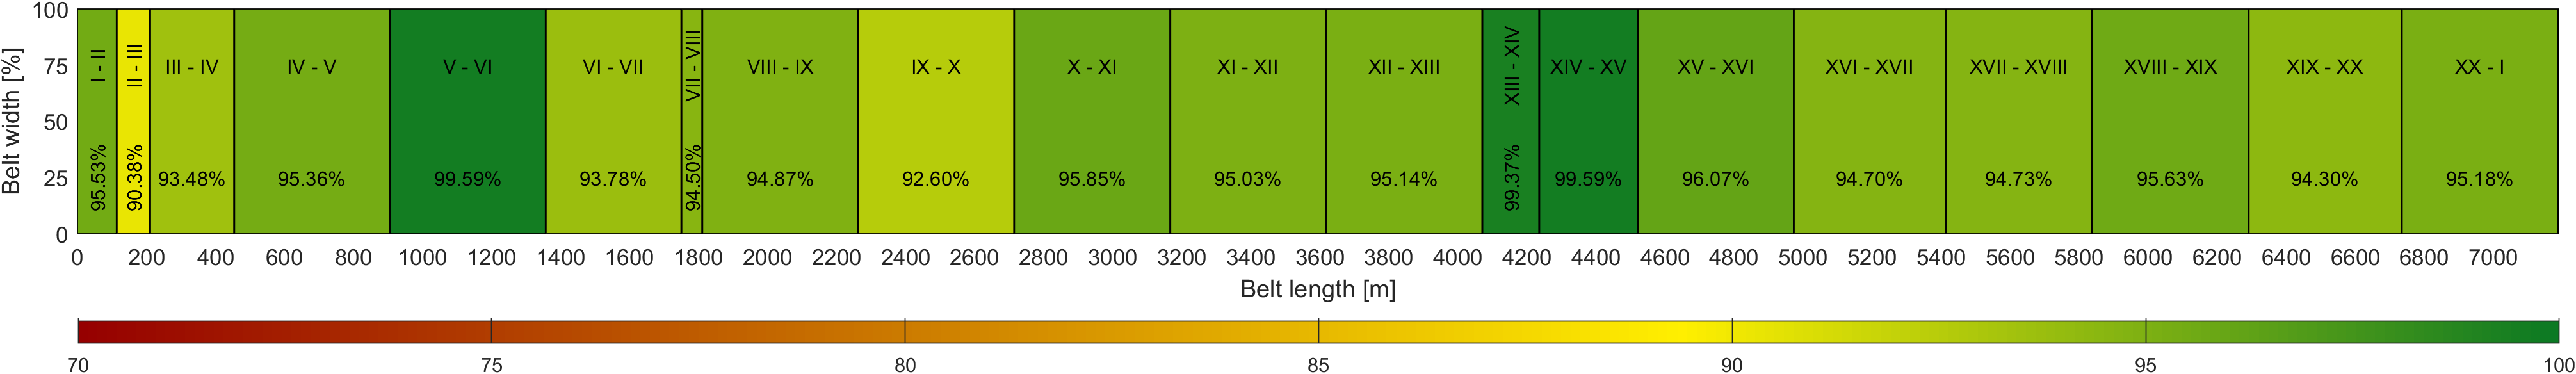
A visual map of belt sections assigned colors according to a core wear scale—based on a selected metric (e.g., core damage density within a section or the area density of the damage-signal field)—makes it possible to immediately identify segments with different wear levels. This allows the user to assess the belt’s technical condition “at a glance,” while the color scale supports classification of belt sections and highlights areas requiring special attention. The condition map is a practical tool for maintenance decision-making, including prioritizing actions, planning service work, and selecting sections for verification and repair.
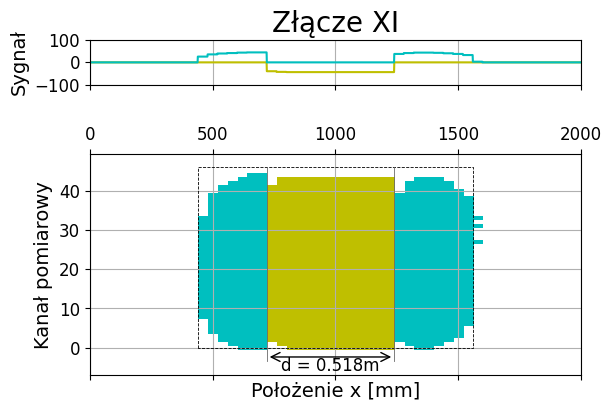
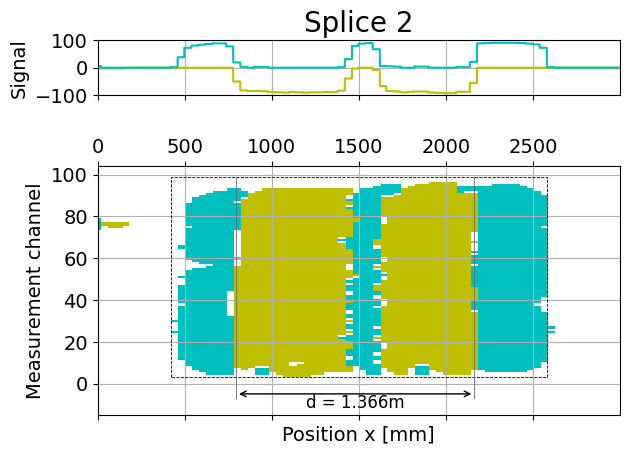
DiagBelt+ enables evaluation of splice geometry and workmanship quality across the full belt width. Signal visualization in the splice zone helps quickly identify asymmetries and irregularities, compare splices with one another, and track changes over time. This makes it easier to plan maintenance and reduce the risk of failures related to splice condition or quality.
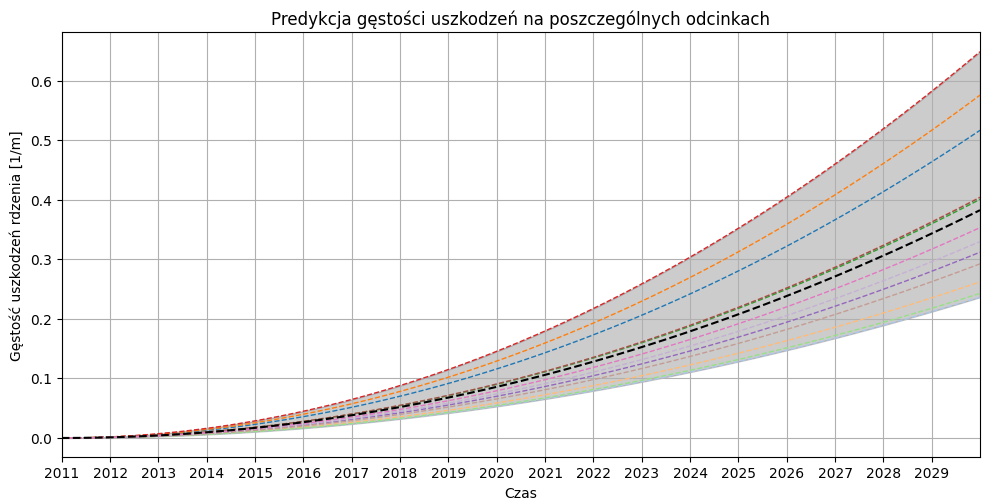
Trend analysis makes it possible to compare successive inspections and assess whether core degradation is progressing,where new hotspots are emerging, and which areas require more frequent monitoring. It is a key tool for predictive maintenance: instead of reacting to a failure, repairs, refurbishment, or section replacement can be planned in advance. Comparing measurements also helps evaluate the effectiveness of actions taken (e.g., splice repairs, changes in belt tracking, or system adjustments). In practice, trends turn a single inspection into an ongoing belt condition monitoring process.
BeltSonic is a system for measuring conveyor belt thickness, enabling fast and repeatable assessment of cover wear. By measuring both along belt sections and across the belt width, it helps identify zones of uneven wear, local material loss, and areas requiring verification or repair. Results can be presented as thickness maps and profiles, making interpretation easier and supporting maintenance decision-making. BeltSonic helps plan service actions and belt replacements, reducing the risk of unplanned downtime caused by excessive belt wear.
Thickness measurements can be performed in a way that is adapted to the belt geometry and installation conditions—across the full belt width. Results are reported with a defined longitudinal resolution (measurement step along the belt length) and transverse resolution (number of points/tracks across the width). This enables results to be compared over time and the wear rate to be tracked for specific belt sections.
Supported belt width range: up to 2500 mm
Transverse resolution: 20 points per 1 m
Longitudinal resolution: measurement every 10 mm at 1 m/s belt speed
Thickness measurement accuracy: ± 0.2 mm
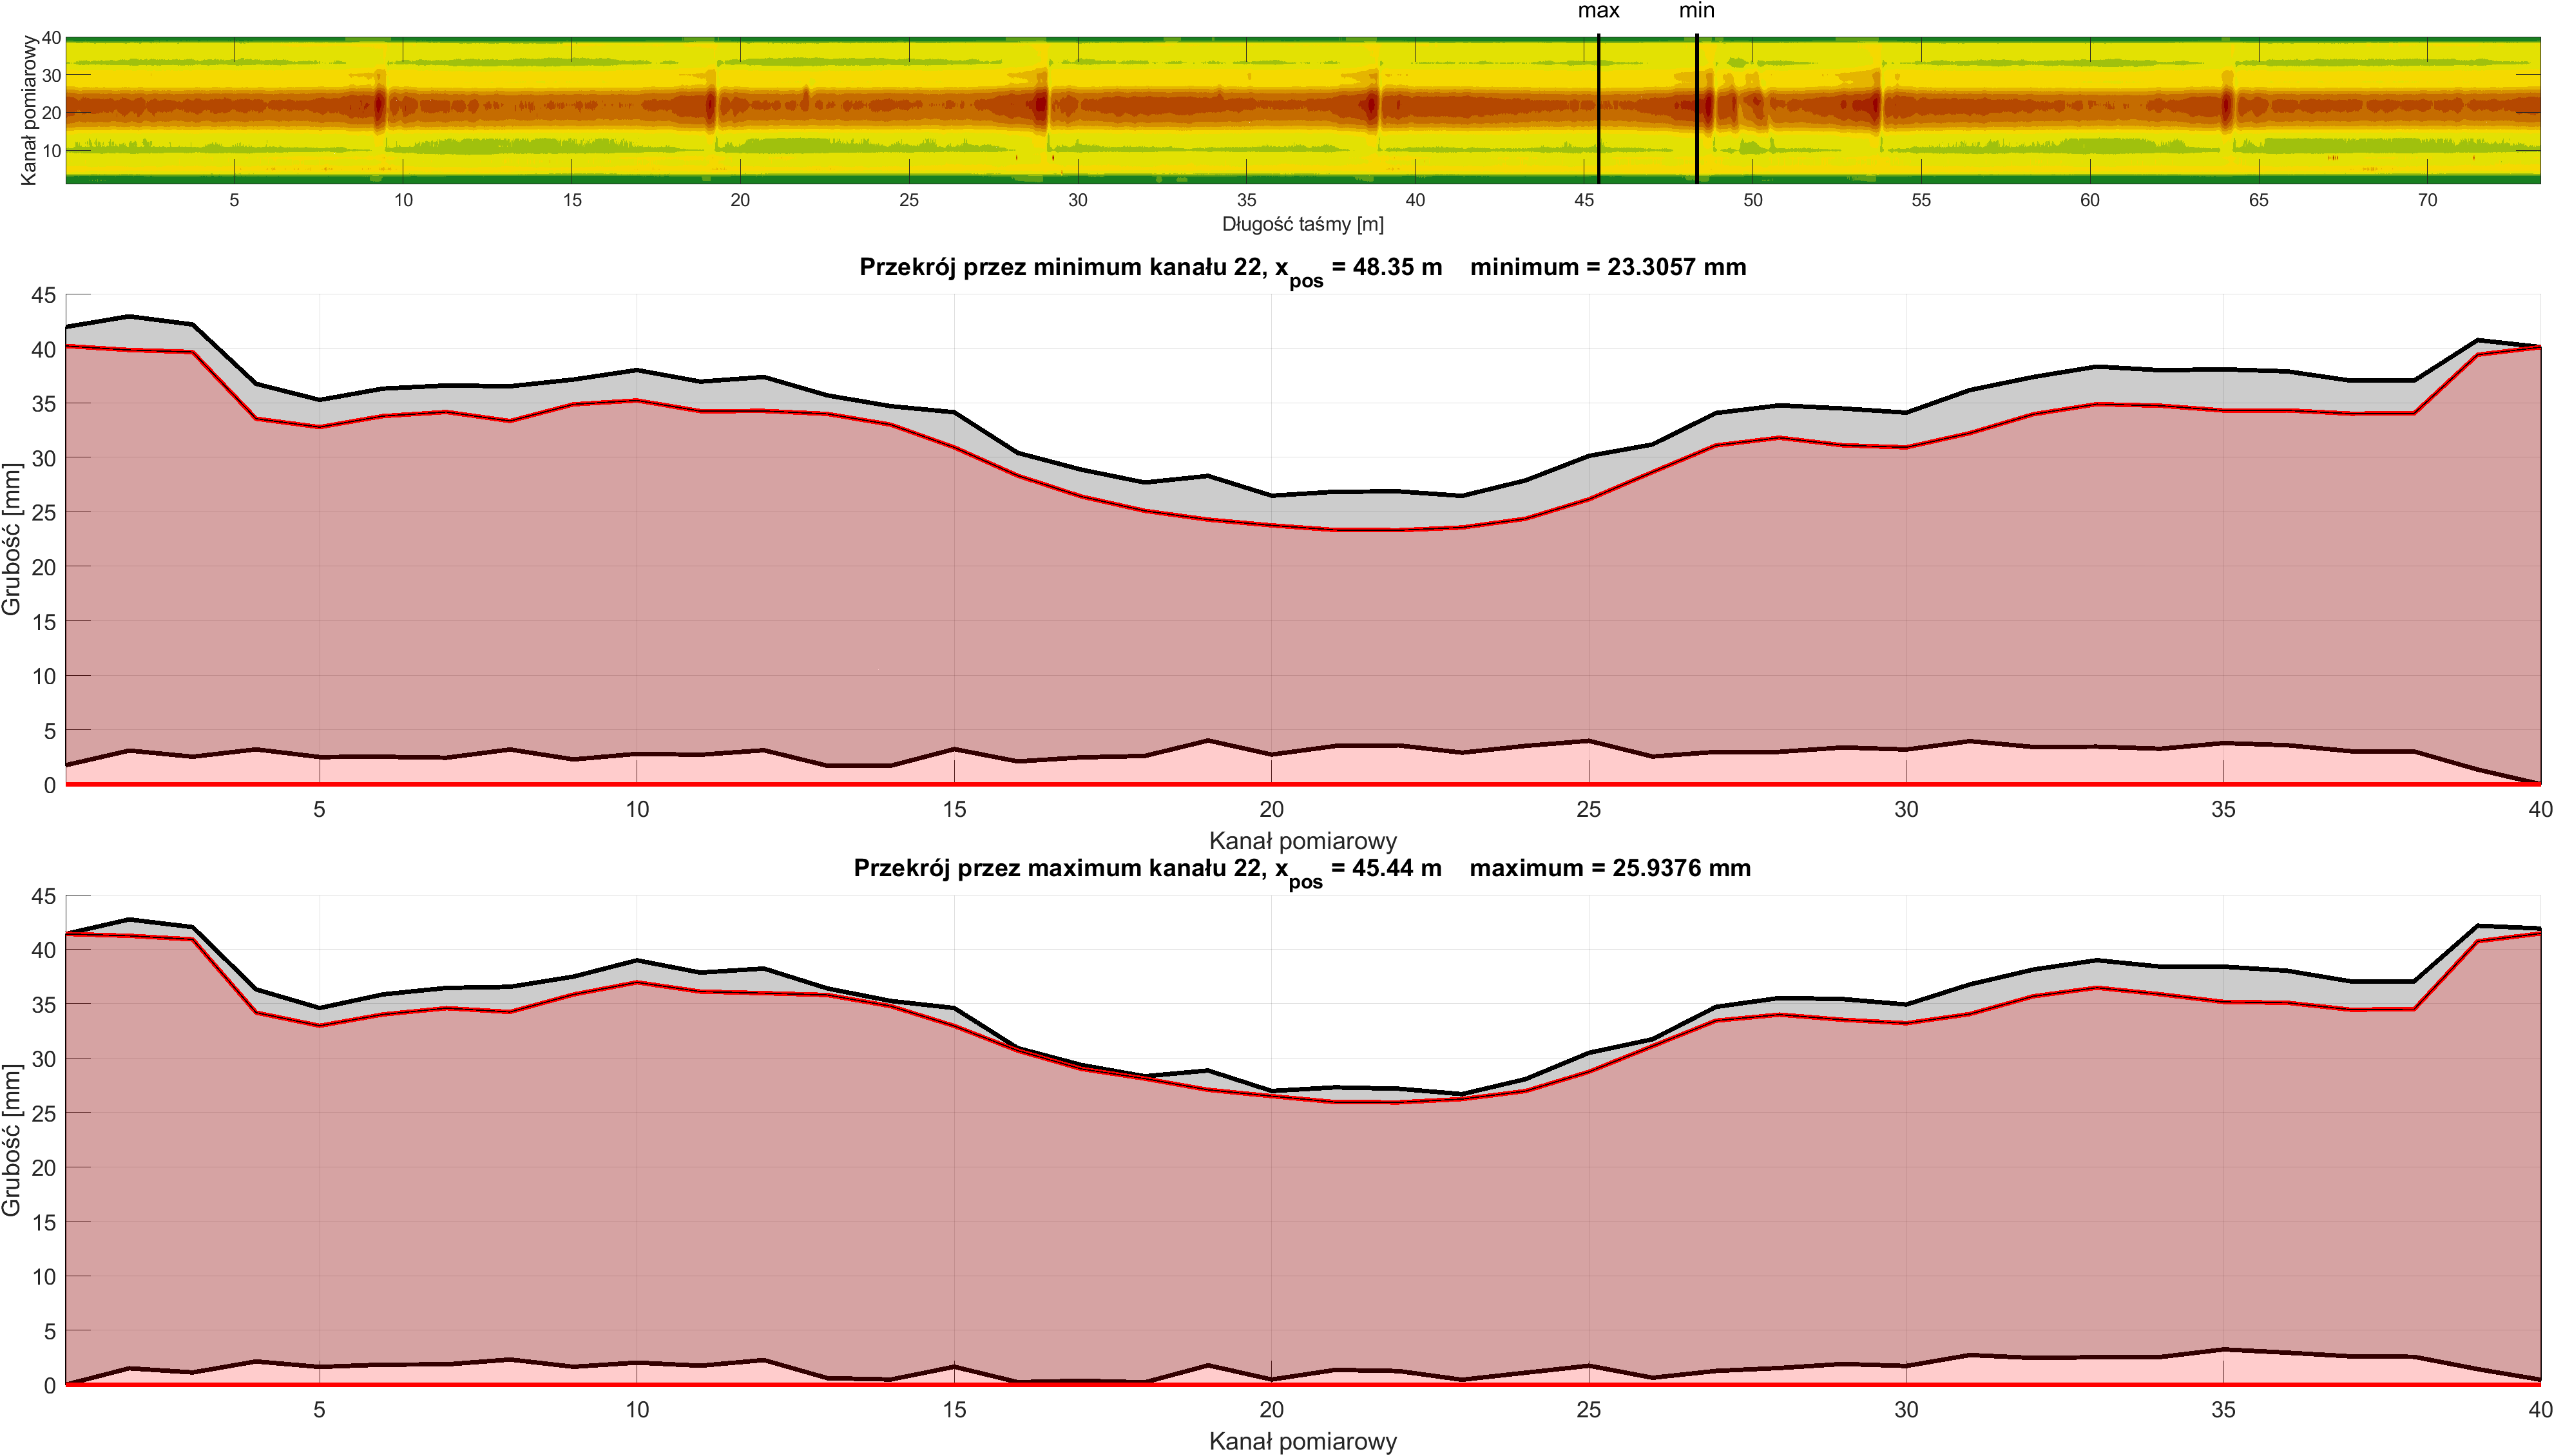
BeltSonic presents measurement data in multiple views, making the results easier to interpret. The XZ view allows analysis of thickness changes along the entire belt length and helps identify key areas of variation. The YZ view shows the thickness distribution in the transverse cross-section (wear across the belt width), while the XY view provides context for thickness changes relative to height. In addition, a 3D viewis available, which organizes the data visually and helps understand the structure and location of problematic areas.
Measurement results form a dense data grid from which statistics are calculated both for the entire inspection and for selected belt sections. Presenting the data as a contour map makes complex information easy to interpret—patterns, differences, and out-of-norm areas become immediately visible. A key feature is the scalable color palette, which allows belt thickness to be quickly related to nominal values (e.g., green) and critical thresholds (e.g., red).
Transverse cross-sections are a useful tool for assessing wear patterns and identifying areas of excessive wear. The analysis can be expressed as a percentage thickness loss relative to the nominal thickness, which makes it easier to compare sections and quickly assess risk. In practical terms, it helps determine not only that the belt is thinner, but also where and how it is wearing (e.g., in bands, asymmetrically, or locally). The system also accounts for real conveyor operating conditions (vibration), and the use of two measuring heads can enable determination of the cover profile.
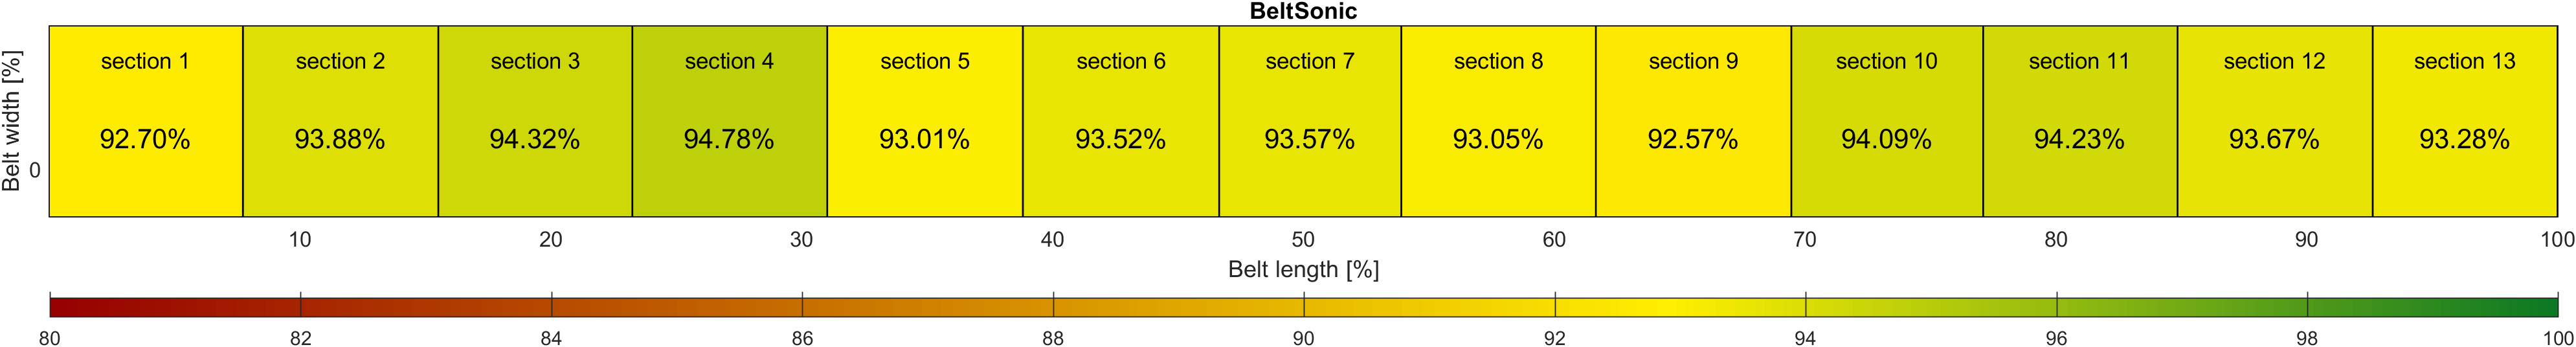
This is a clear “quick assessment” view: belt sections are assigned colors according to the percentage of cover wearr, making it easy to immediately spot areas in better or worse condition. The color scale supports classification of belt sections and helps highlight areas requiring special attention. The map is a practical tool for maintenance decisions—what to monitor, what to verify in the field, and where to plan service actions.
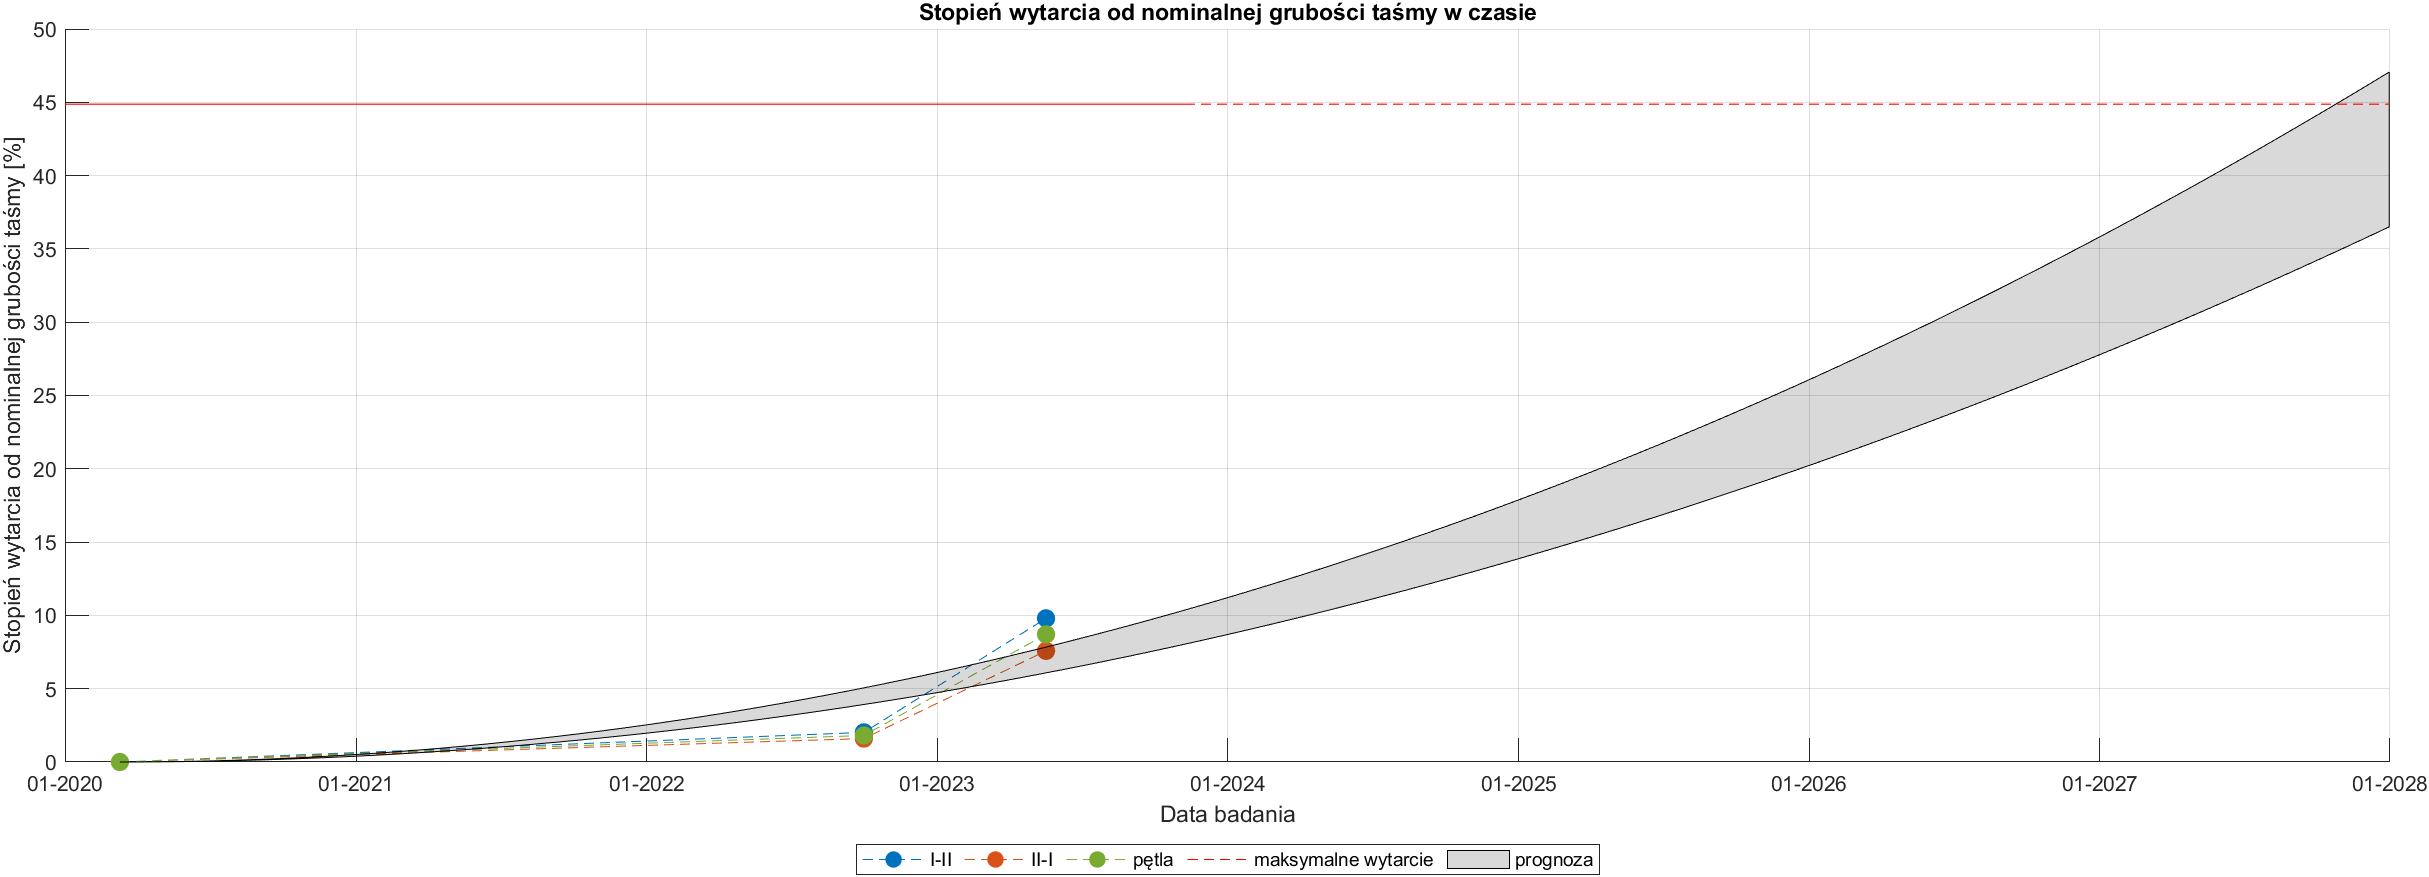
Based on wear data and trends, the analysis can move from “measurement” to “forecasting.” A wear prediction curve helps estimate how much operating time may remain until limit values are reached. This supports proactive replacement and maintenance planning rather than reactive action after a threshold has been exceeded. In practice, it makes it easier to set priorities and schedule maintenance activities.
BeltAlert is developed as a tool for rapid detection of longitudinal tears in conveyor belts and to support maintenance response. The system is currently in the pilot phase, which means we are validating its performance in both laboratory and real-world conditions and refining the configuration and software operation for specific installations and typical failure scenarios.
The solution is based on vision technology – an array of three 3D cameras —and is intended for belts up to 1600 mm wide. According to the device specification, the minimum detectable tear is approximately 1.5 mm in width and 60 mm in length. The portable design enables repeated installation and measurement at different locations, on the return strand at a height of 300–2000 mm. Communication is via Ethernet, the declared ingress protection is IP67with a dust-tight enclosure, and the software supports data acquisition and export of raw results (e.g., to .csv) on a Windows platform.
DiagPress provides vulcanizing press diagnostics based on thermography and time-based analysis of the temperature distribution on heating plates. The inspection makes it possible to assess heating uniformity, warm-up rate, and temperature stability throughout the operating cycle. Results are presented as temperature maps, statistical analyses, and trend plots, making it easier to identify out-of-spec zones and compare the performance of both plates.
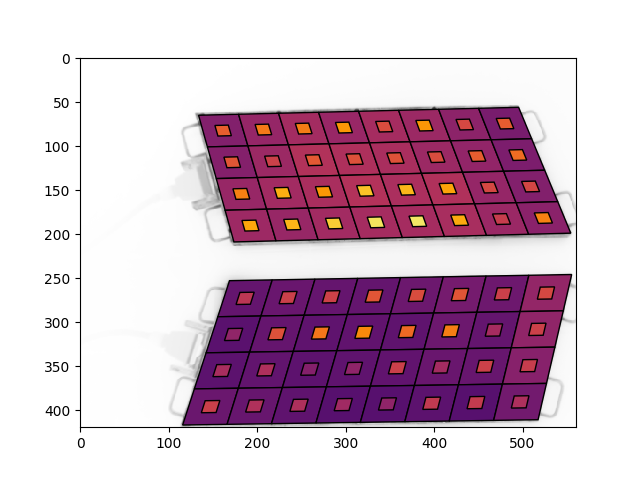
During measurements we use reference elements with a known emissivity (ε) and high thermal conductivity, which stabilise observation conditions and make it easier to compare results between plates and across different measurement dates. This helps reduce the influence of reflections and surface emissivity variability on thermal camera readings. The warm-up process is recorded at a fixed time step (every 20 s), allowing analysis of both the ramp-up to operating temperature and temperature stability over time.
We analyse the heating plate warm-up curve as a function of time—from start-up to reaching operating temperature and throughout the stabilization phase. Comparing the curves for the two plates makes it possible to assess whether they heat up at a similar rate and maintain stable temperatures. Fluctuations after reaching operating temperature may indicate control issues, uneven performance of heating zones, or the influence of operating conditions.
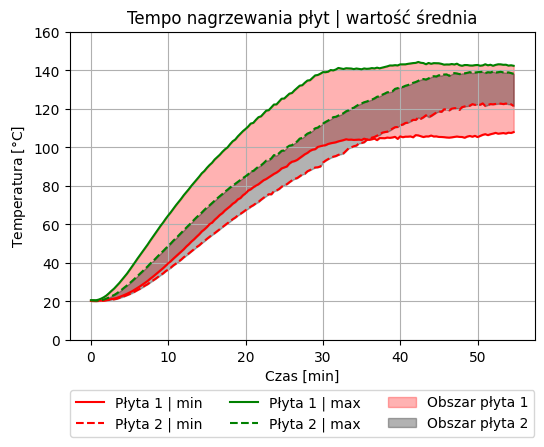
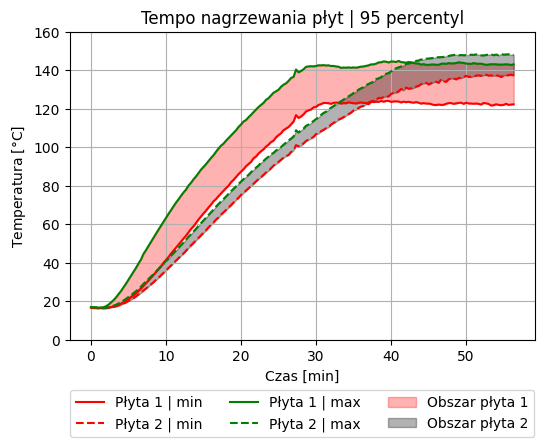
Min–max bands show how large the temperature differences are across the plate surface at a given moment. The wider the band (greater spread), the lower the heating uniformity and the higher the risk that different parts of the splice will be vulcanized under different conditions. We also compare the spread between plates to identify which plate generates greater non-uniformity.
We present results as a map/grid of measurement points, which allows “cold” and “hot” zones to be located quickly. Mean values describe the overall temperature level in the analysed area, while maximum values highlight local peaks (potential overheating) and outlying regions. This makes it easy to pinpoint areas requiring attention—both in terms of process quality and diagnostics of the plate itself.
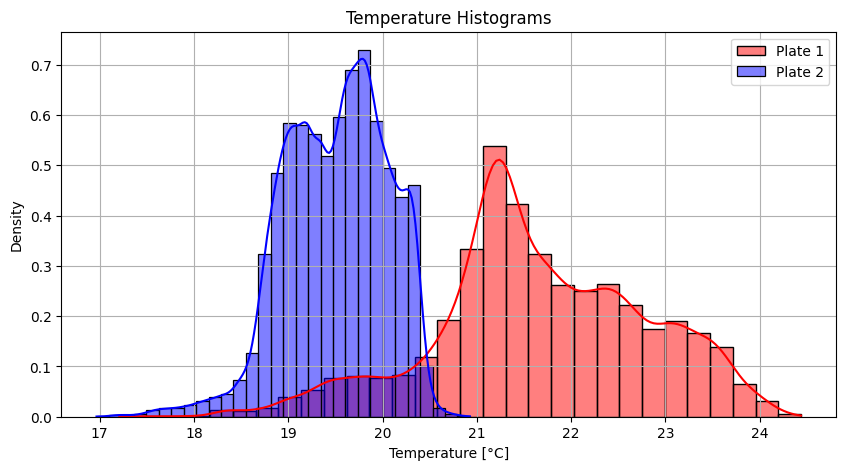
Temperature histograms show how tightly clustered the plate temperatures are. A narrower distribution indicates more uniform heating, while a wider one reflects greater variability and a potentially higher risk of non-uniform vulcanization. Plotting both plates on the same chart helps determine which one operates more consistently and closer to the target parameters.
ul. na Grobli 15,
50-421 Wrocław, Poland
© 2026